What would you do if you had tool that could decrease the time spent trying to understand the patterns and behaviors of currently active crypto coins? Imagine an app that supports your crypto coin analysis, that’s what I’m building.
This is my first article in a while. Checking in, my last piece was in 2020, during the first months of global lockdowns. A lot happened to me and to the rest of the world since then. However, my need and will to create content, improve my technical capabilities, and become financially independent never disappeared.
In 2022, I want to produce one piece of content each month to continue building my content creation muscle, improve my strong technical foundations, and put myself out there to reach communities in need of analytical knowledge, mentoring, support.
I wanted to start the year by writing this article to fix the concepts and deliverables in my head on paper and luckily, to spark the curiosity of like-minded folks interested in investing and the crypto world.
The project
The project, that will probably last for this year (or more) has the nickname “Cryptovaluer”. It is a tool that is able to provide support to investors based on well-known technical and non-technical signals. It won’t provide financial advice, but it will support someone that, like me, is always interested in understanding trends and potential opportunities in the market.
It is known that, the best tool and apps are those created to serve a need, such as the need of the creator to achieve something. I imagine that Cryptovaluer is able to provide insights and information regarding currently active crypto coins. While trying to learn more about the world of investing and trying to get better myself at it, Cryptovaluer will contain my learnings regarding signals, momentum and trading strategies.
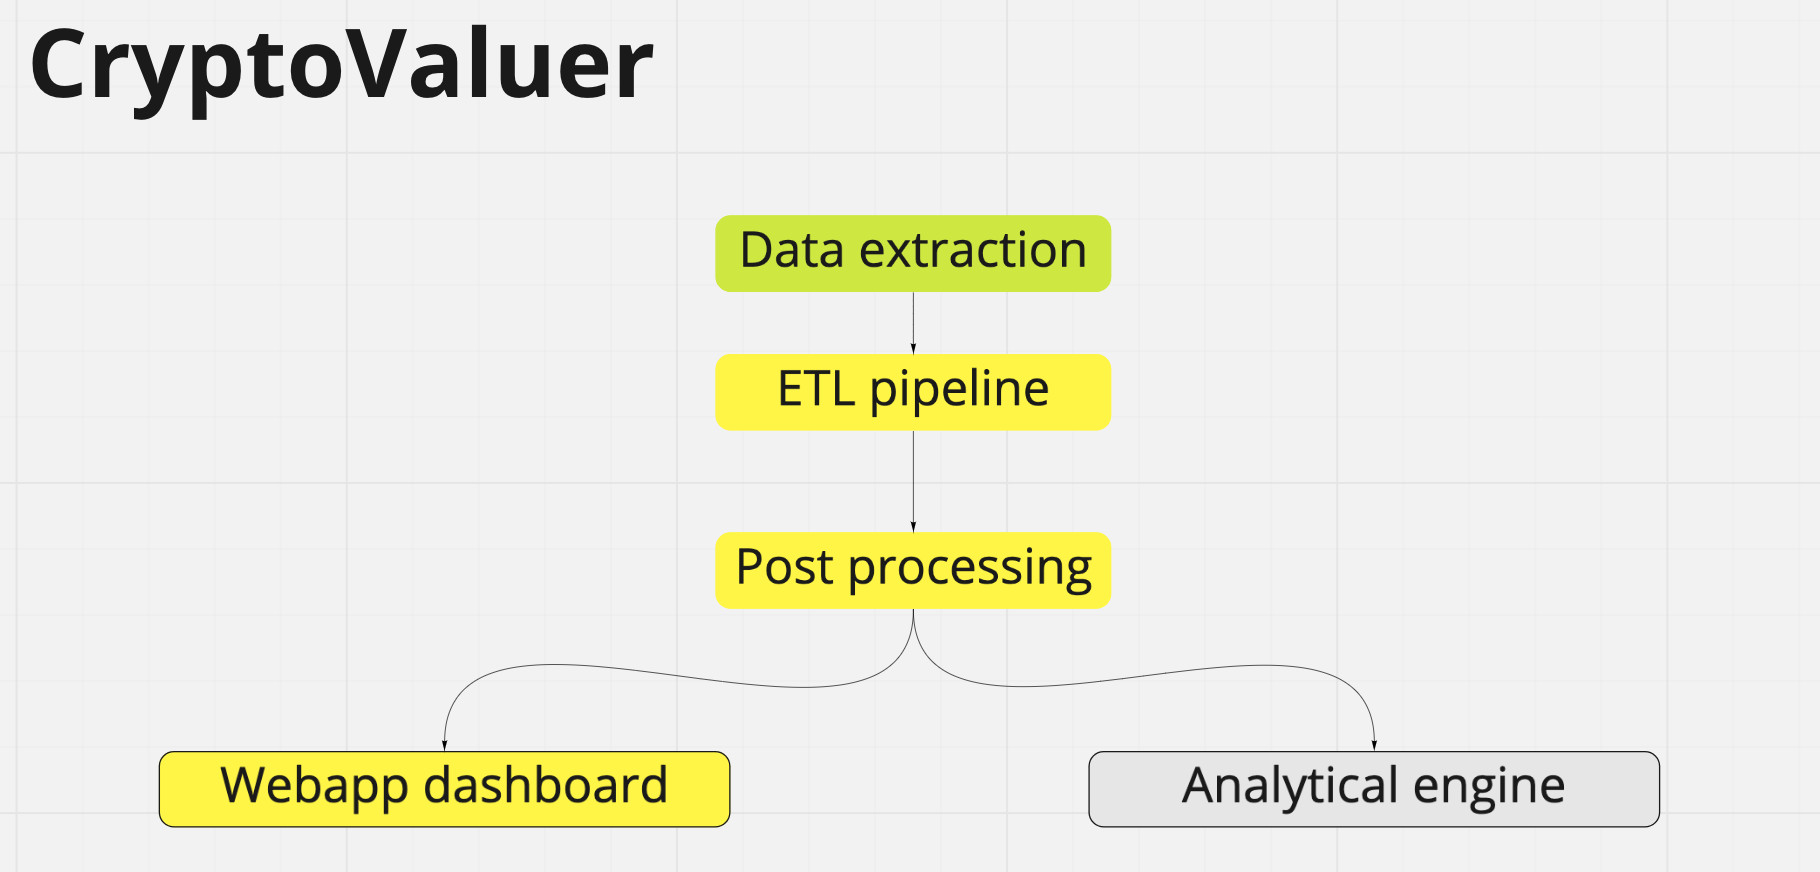
I imagine the projects developping into three major areas.
The goal
The overarching goal of the tool is to facilitate the study of a specific coin (or a pair of coins, the possibilities are endless…). This is an incredibly complex, challenging and fascinating problem. The best way to approach a multi-variable a multi-faceted problem is to decompose it into smaller, tinier pieces that are simpler and easier to handle. That’s why I decided to use the famous statement divide et impera (divide and conquer) to make my life easier and make the project seem less daunting. Nothing new here, this is a technique already used in the business world by many successful people [at the end, a Ted Talk that I very much like on the topic].
The deliverables
Create the pipeline (MVP ready)
The first step of any analytical project is to find the data that represent the problem you are trying to solve.
From a bunch of time now I got experienced in scraping information from the internet. Using a multitude of sources, I extracted the historical data of a number of crypto coins and generated an automated pipeline that streams into a Postgres DB. This is ground zero!
Create the visualization (MVP in progress)
To make the data available and start putting the data into the audience’s hands, I created the first iteration on the visualization of the first coins and the first technical signals.
The first Dashboard is a simple one, that leverages Plotly and Streamlit to create a dynamic Dashboard that allows the user to select one crypto coin from a list, as well as a number of simple technical signals.
The next step is to polish this MVP and publish the Dashboard to make it available to the public. This will be my focus for the next month. I’m planning to explore Heroku to accomplish this. The first MVP is somewhat making its first steps into the world…
Next steps and further development
I’m planning to update this project plan as I progress further into the work. In the meantime, these are the steps that I envisioned, once the visualization MVP is finalized and published:
- Add complex technical signals and allow for coins comparison
- Start exploring machine learning algorithms that could leverage the information from the time series and the technical analysis to backtest models. The idea here, is to have a model able to identify momentum, buying or selling signals. I know, this is probably an unicorn but I believe this is an incredibly useful excercise and could represent a stepping stone for new ideas and explorations
- Start scraping the web for external signals and factors. For those following the crypt world, it is known that a tweet from Elon Musk on Dodge or Ethereum could send the coin value skyrocket in hours.
If this project interests you, get in touch! If you need my technical advice on your project or you have an Analytical project that could rely on an additional hand, I’m all ears! Send me a message and let’s understand how we can work together!
Project backlog
For those interested, this is my current project backlog
ETL
Currently, the pipeline is manual and I run it every weekend to refresh the data. Further improvements: Automate the pipeline so that it runs every weekend Parallelize the pipeline, currently it takes two days to scrape and pre-process the data for analytics Sync the data to the cloud (it is currently all stored in my local machine and this doesn’t make my laptop happy!). However, these steps need some further reads into cost effective cloud storage…!
Visualization
Polish the Dashboard to make it reliable on a selected list of coins Publish the Dashboard to make it available
The engine
Leveraging analytics and machine learning, I will build an engine that is able to recognize technical patterns and complex signals to evaluate momentum, buying and selling indicators.
This is still open to curiosity, dreaming and imagination!
It is not because things are difficult that we do not dare; it is because we do not dare that things are difficult.. L.A. Seneca
Bonus video - How to achieve your most ambitious goals